Ede Migh, Vivien Miczán, Frederik Post, Krisztian Koos, Attila Beleon, David Kokai, Zsanett Zsófia Iván, Istvan Grexa, Nikita Moshkov, Reka Hollandi, David Csikos, Nora Hapek, Flóra Kaptás, Ferenc Kovacs, Andras Kriston, Diana Mahdessian, Ulrika Axelsson, Csaba Pal, Emma Lundberg, Mate Manczinger, Andreas Mund, Matthias Mann, Peter Horvath
Ede Migh and his colleagues have created a high-resolution map of protein changes during cell division, providing a detailed look into the molecular machinery of mitosis. This research, currently available as a preprint on bioRxiv, utilized BIAS to perform the sophisticated image analysis required to track these dynamic processes. The study offers a valuable resource for the scientific community, including an interactive online platform, to explore the complex proteomic landscape of mitotic progression.
Mapping the Proteome Through Mitosis
Cell division, or mitosis, is a fundamental process of life, essential for growth and development. It’s a highly dynamic and precisely regulated sequence of events, and errors can lead to diseases like cancer. While the visual stages of mitosis are well-documented, a deep understanding of the corresponding changes in the proteome—the complete set of proteins in a cell—has been lacking, especially with high temporal resolution.
This is the challenge that Migh et al. tackled in their recent work. They developed a powerful workflow to create a detailed “morpho-proteomic atlas” of mitosis. The key to their approach was combining advanced imaging techniques with cutting-edge proteomics, all tied together with sophisticated data analysis.
Here’s a breakdown of their innovative method:
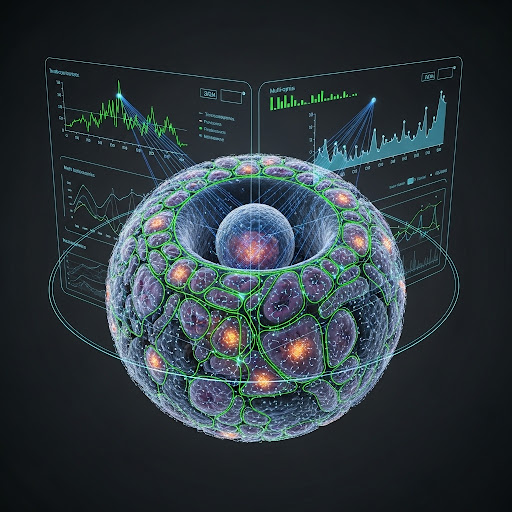
- High-Resolution Imaging: The researchers used live-cell imaging to capture videos of cells going through mitosis. This allowed them to precisely determine the timing of different mitotic stages for each individual cell.
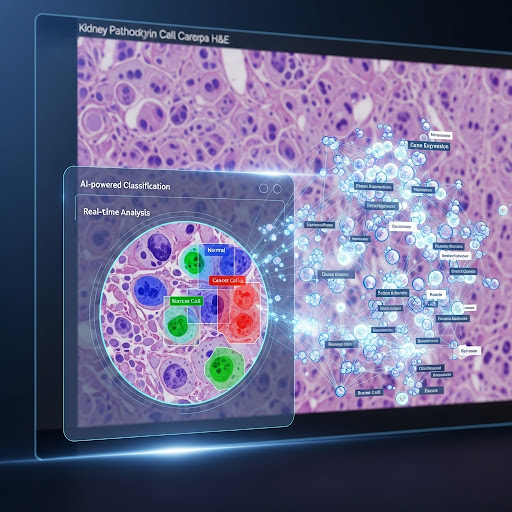
- AI-Powered Image Analysis with BIAS: Our BIAS software was instrumental in this phase. The high-resolution images were analyzed using BIAS to accurately identify and segment the cells. More importantly, BIAS was used to classify the cells into specific sub-stages of mitosis based on their morphology. This allowed the researchers to create a very fine-grained timeline of the mitotic process, with a resolution of less than a minute.
- Deep Visual Proteomics (DVP): After classifying the cells with BIAS, the team used the DVP method, which combines imaging, laser microdissection, and mass spectrometry. For each precise mitotic stage identified, they collected the corresponding cells and analyzed their proteomes.
By applying this workflow, the team was able to quantify over 4,350 proteins and identify 147 that change significantly as mitosis progresses. Their analysis revealed coordinated waves of protein expression and degradation, providing a detailed picture of the molecular choreography of cell division. They even identified a new protein, C19orf53, that appears to play a role in mitosis.
To make their findings accessible to the broader research community, the authors created the Mito-Omix, an interactive online platform where anyone can explore the data. This valuable resource will undoubtedly fuel further research into the mechanisms of cell division and its deregulation in disease.